Updated 9th April 2022
This article has not been updated recently
Third wave reaches new peak


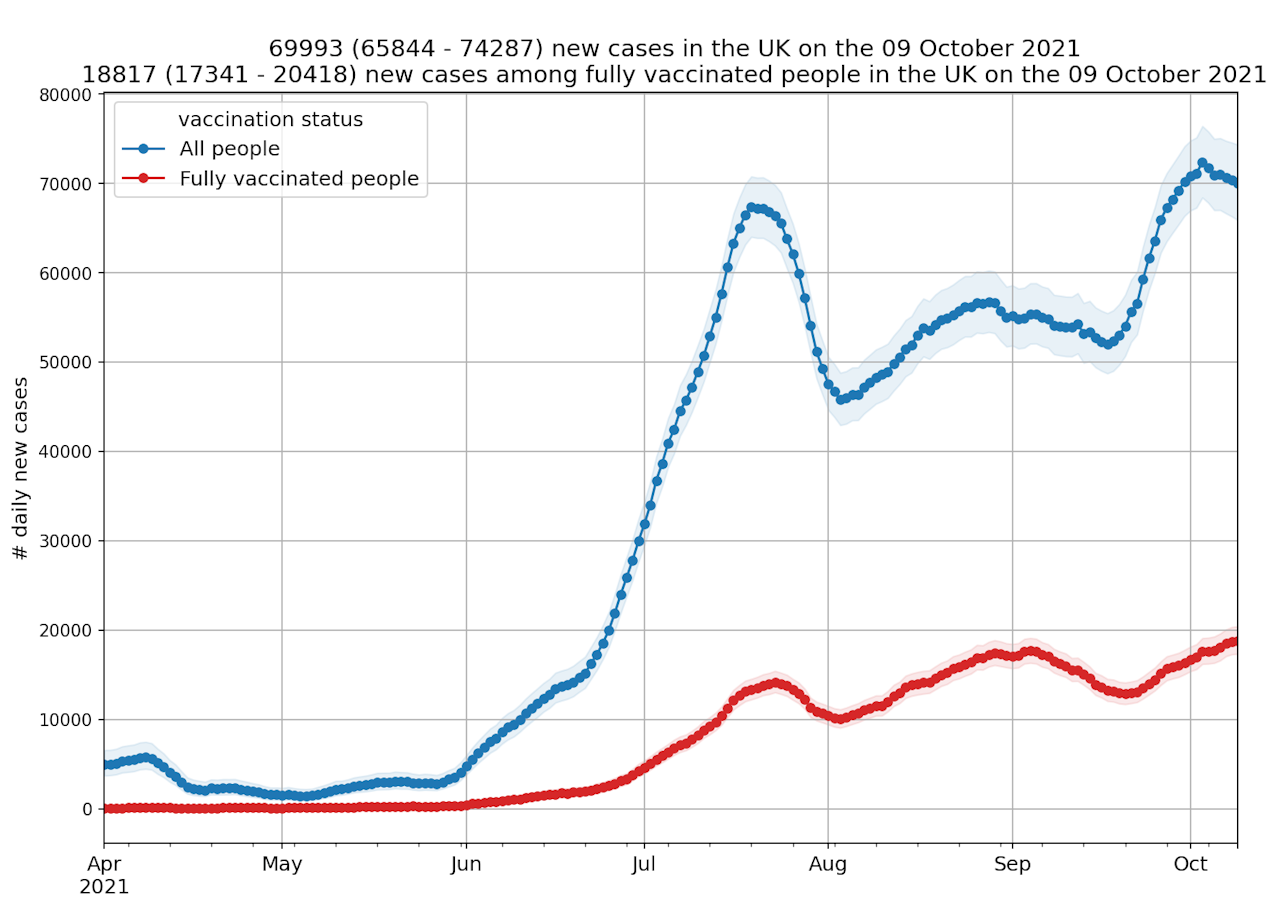
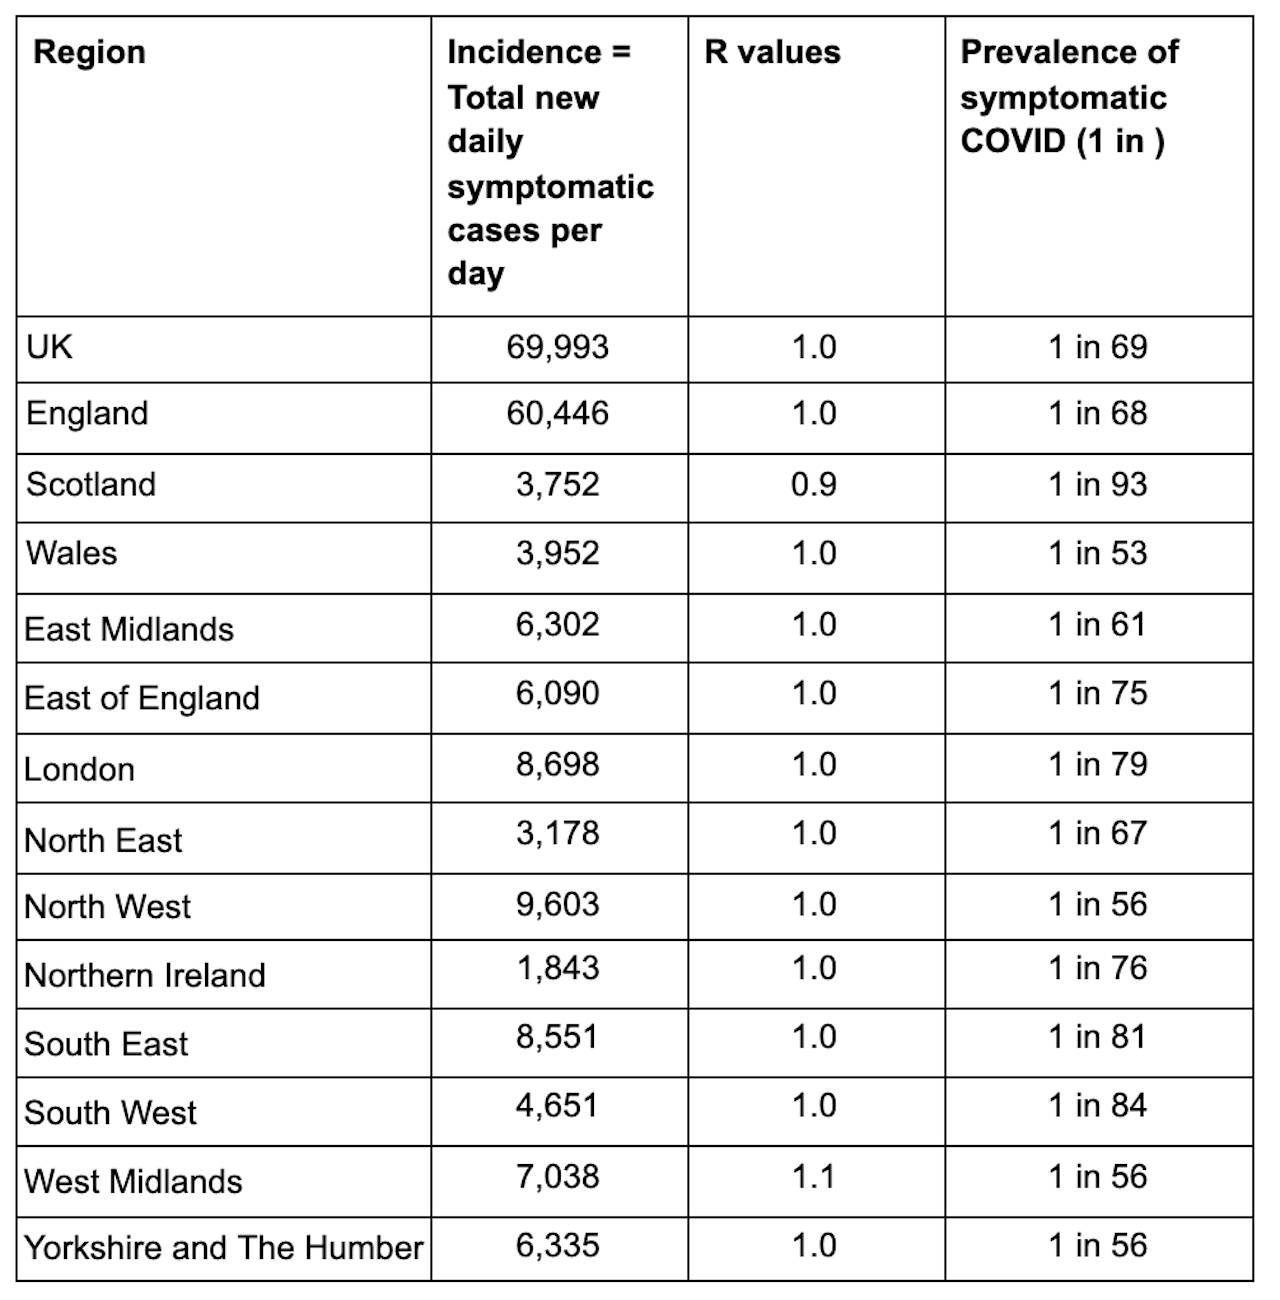
According to ZOE COVID Study incidence figures, in total there are currently 69,993 new daily symptomatic cases of COVID in the UK on average, based on PCR and LFT test data from up to five days ago. A decrease of 2% from 71,111 new daily cases last week.*
In the double vaccinated population, it’s estimated there are currently 18,817 new daily symptomatic cases in the UK. Cases have been slowly increasing for a few weeks, with 16,957 cases last week (Graph 1).
The UK R value is estimated to be around 1.0 and regional R values are; England, 1.0, Wales, 1.0, Scotland, 0.9 (Table 1). Cases have been falling steadily in Scotland for the past few weeks. Rates are highest in the Midlands and North of England where vaccine rates are some of the lowest.
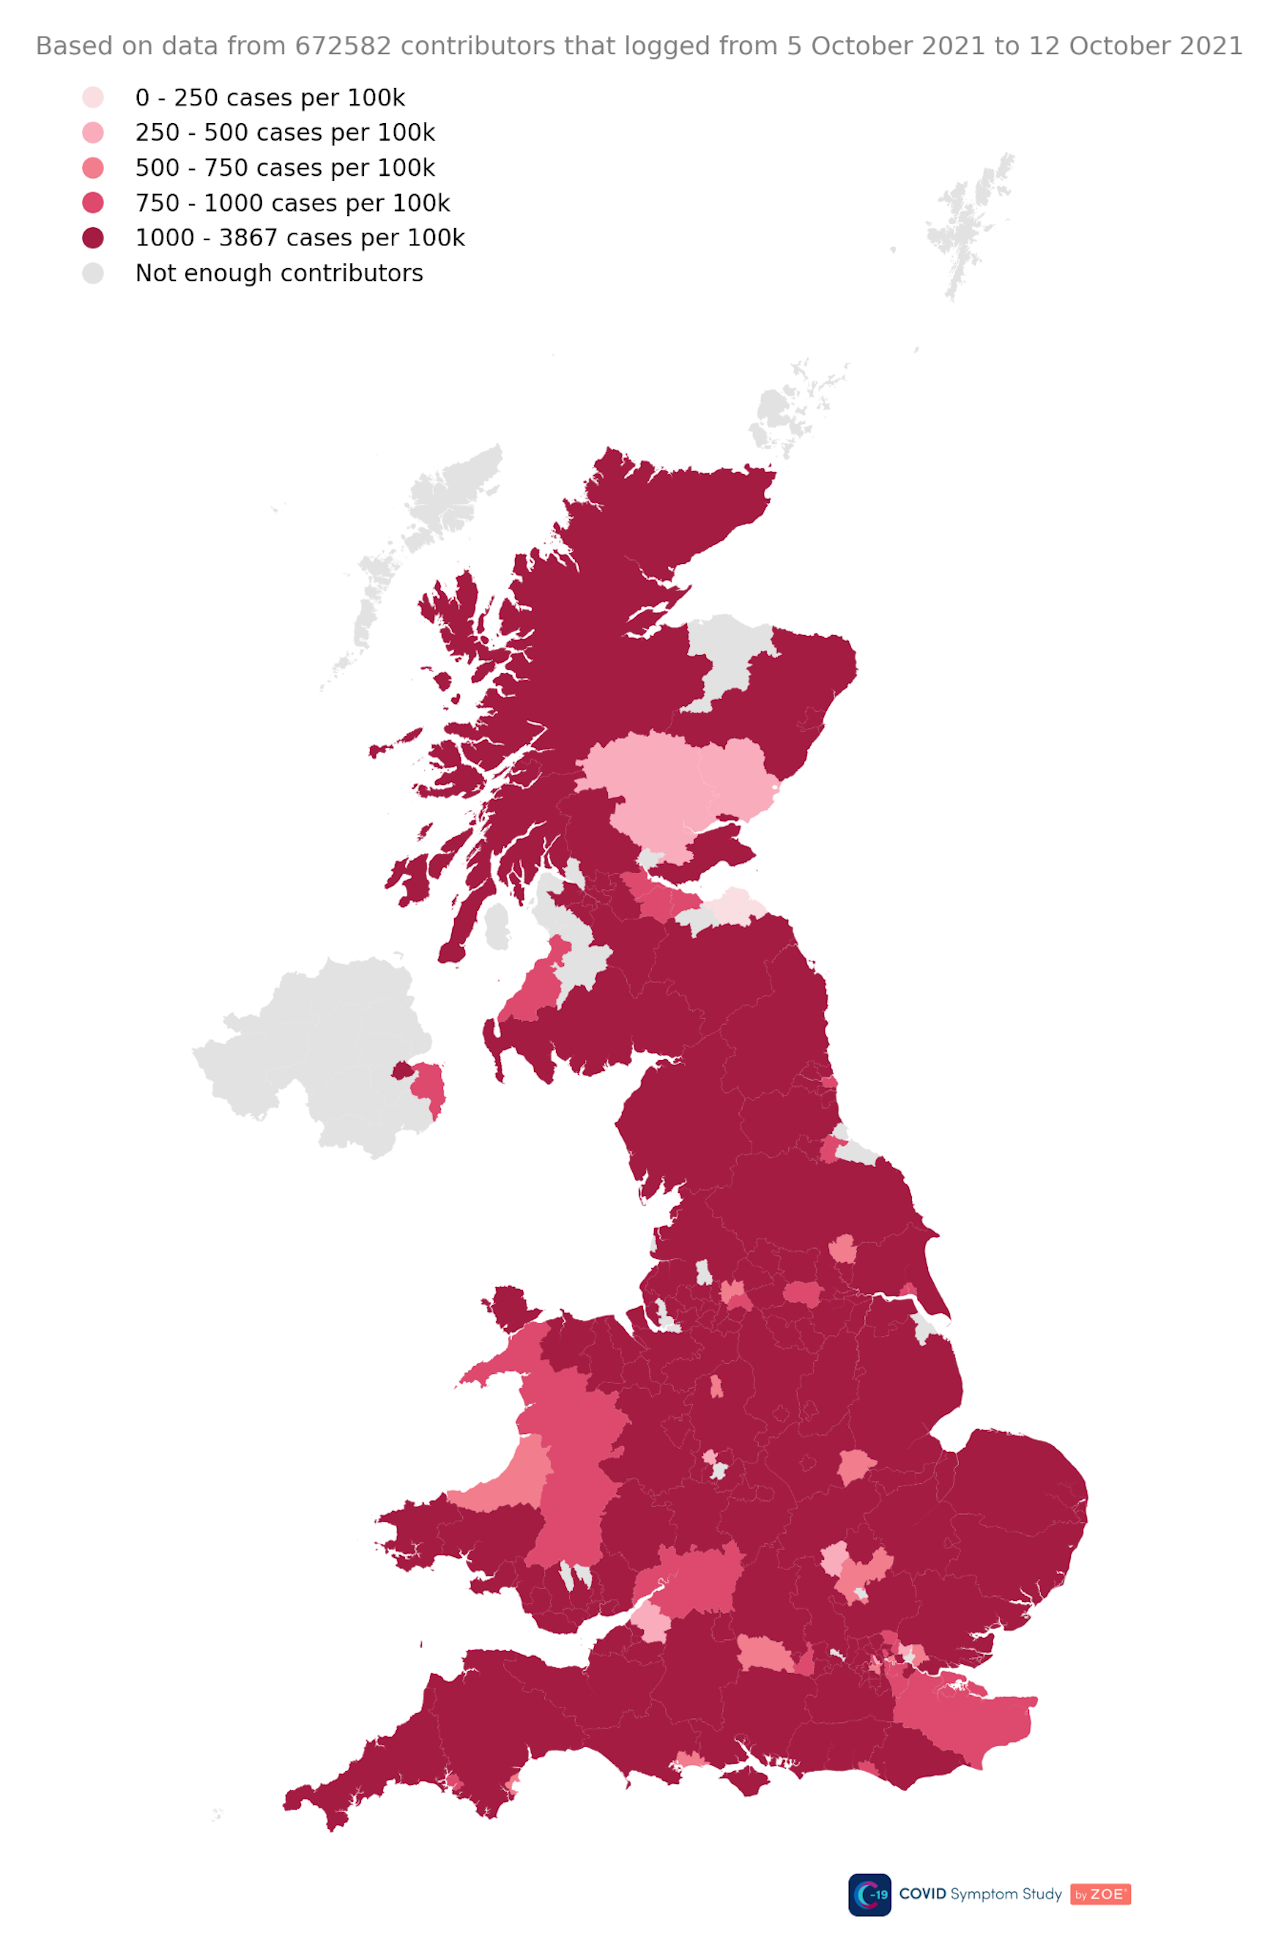
In terms of prevalence, on average 1 in 69 people in the UK currently have symptomatic COVID (Table 1).
The number of daily new cases across the age groups cases remain high, but is now finally falling in those aged 0-18. Cases are now rising steadily in 35-55 year olds and remain low in 18-35 and over 55s (Graph 2).
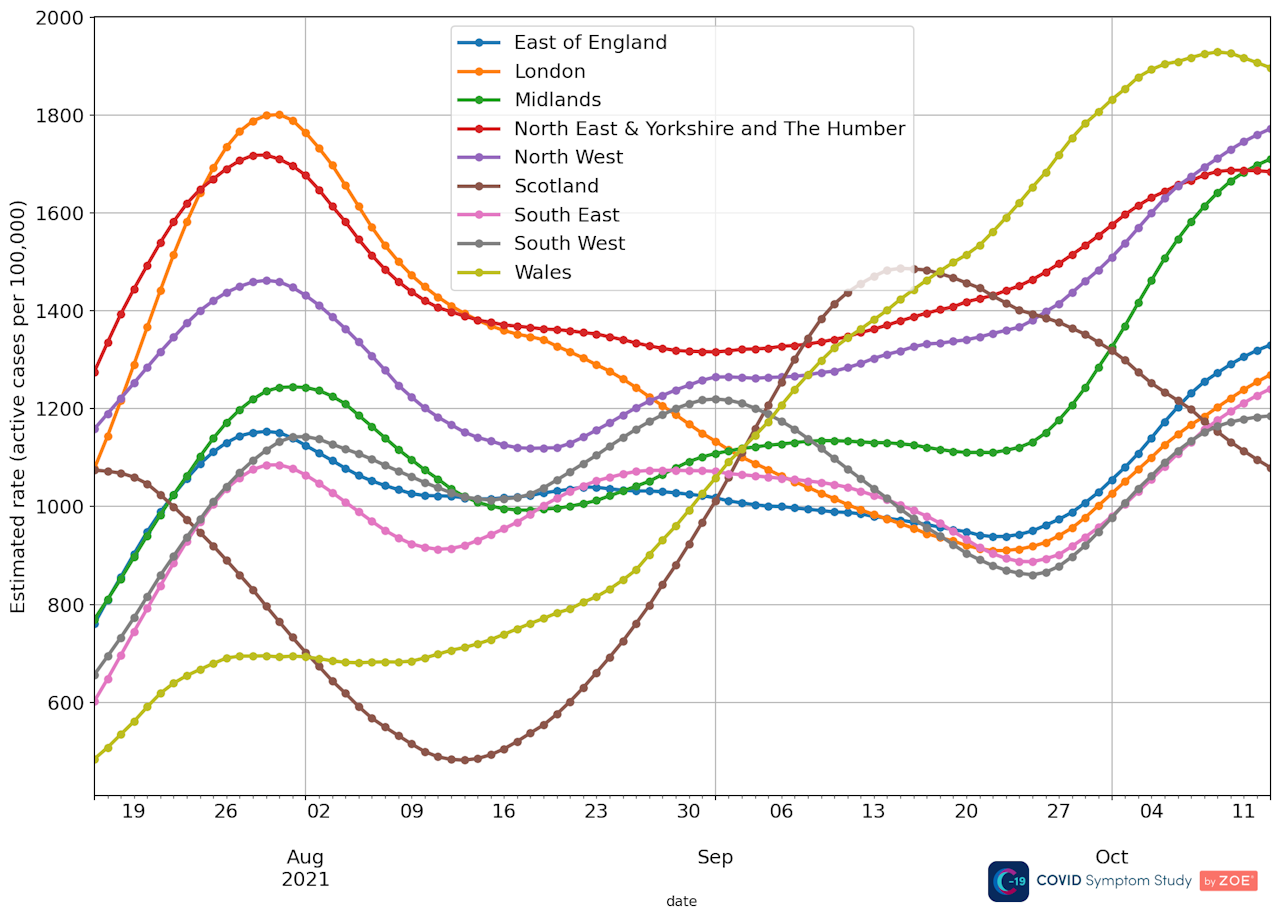
In terms of prevalence, cases are highest in Wales, Midlands, North West and North East. (Graph 3).
ZOE’s predicted Long COVID incidence rate currently estimates, at current case rates, 1,122 people a day will go on to experience symptoms for longer than 12 weeks (Graph 4).
The ZOE COVID Study incidence figures (new symptomatic cases) are based on reports from around 750,000 thousand weekly contributors and the proportion of newly symptomatic users who have received positive swab tests. The latest survey figures were based on data from 43,624 recent swab tests done between 25 September and 09 October 2021.
Professor Tim Spector, lead scientist on the ZOE COVID Study app, comments on the latest data:
“The UK seems to be slowly waking up to the fact that COVID cases are too high, but the reality is they’ve been soaring for months and many countries have put us on their red list. Infections remain high in young people, and look to be spilling over into the 35-55 year olds. If these increases creep into the over 55s it could spell disaster for the NHS this winter.
This week a major UK Care Home provider has confirmed that based on our research, it’s now including cold-like symptoms on their visitor forms to stop potential COVID cases from entering their facilities. This is a bold move as it goes against the official government guidance, but will ultimately save lives, and hopefully others will follow suit.
With cases so high, it’s clear that herd immunity isn't happening, and the risk is most people continue to believe they are safe if they have had COVID or a vaccine. ZOE data shows that vaccine protection wanes over time and a natural infection alone only gives 64% protection, so we need to be doing all we can to get everyone double vaccinated and stop waiting for herd immunity to happen through natural infection.”
Graph 1. The ZOE COVID Study UK incidence figures results over time; total number of new cases and new cases in fully vaccinated

Graph 2. Incidence by age group


Graph 3. Prevalence by region

Graph 4. Predicted Long COVID incidence over time
Please refer to the publication by Thompson at al. (2021) for details on how long covid rates in the population are modelled

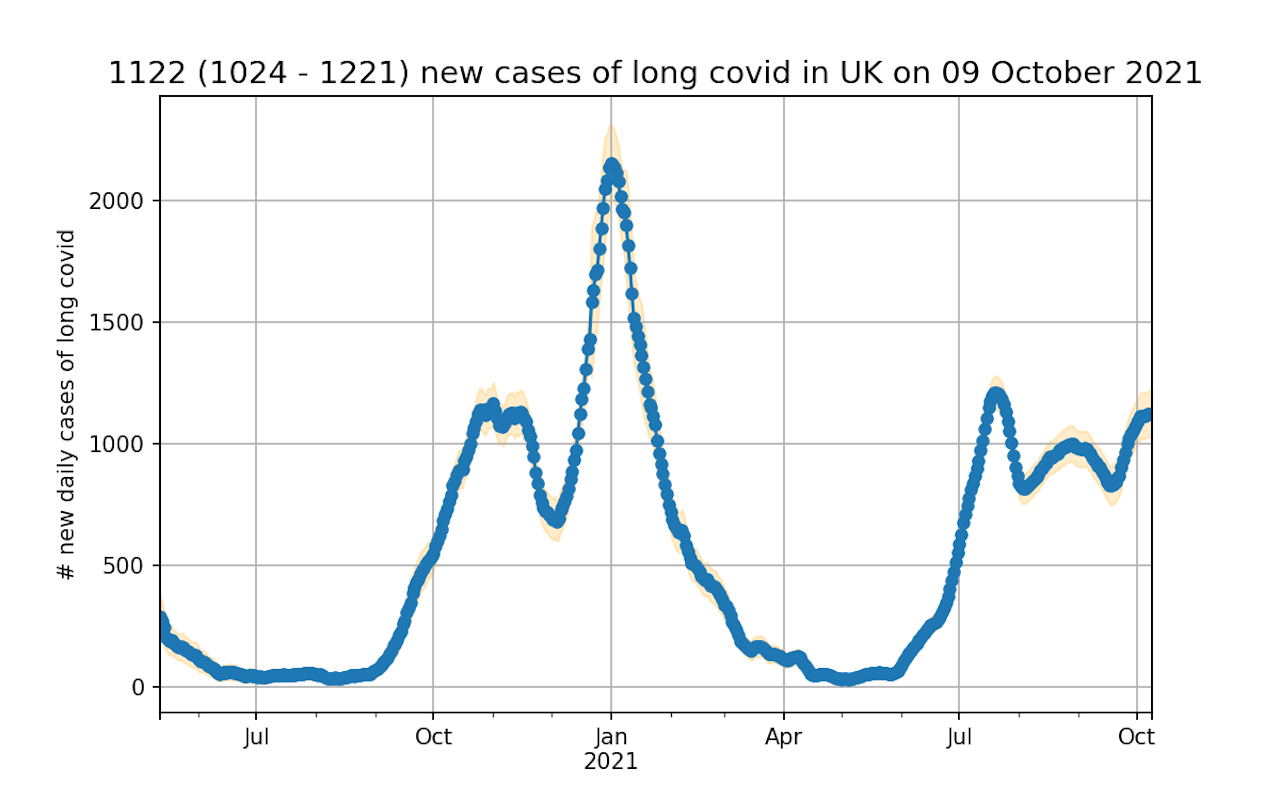
Table 1. Incidence (daily new symptomatic cases)[*], R values and prevalence regional breakdown table

Map of UK prevalence figures